Location:Home Page > Archive Archive
Why Fourier Transform?
2023-08-20【Archive】
1. The origin of Fourier transform
About Fourier transform, you can easily find descriptions of Fourier transform in books or on Internet, but most of them are mystical articles, too abstract, and they are full of lists of formulas that scare people. people understand emotionally. Recently, I accidentally saw an e-book on digital signal processing on Internet. It was written by a foreigner named Stephen W. Smith, Ph.D. It was written very simply. Seven chapters are devoted to Fourier transform of discrete signals from finer to deeper.
Despite fact that this document is in English, I still hold back and read relevant content on Fourier Transform. I hope that many friends who are confused by Fourier transform can get some inspiration.
You really need some patience to understand Fourier transform. Don't think about how Fourier transform transforms. Of course, you also need certain foundations in advanced mathematics. The most basic is series transformation. , of which transformation of Fourier series The basic formula of Fourier transformation.
Second, Fourier transform proposal
Let's first see why Fourier transform exists? Fourier is name of a French mathematician and physicist. His original English name was Jean Baptiste Joseph Fourier (1768-1830). Fourier was very interested in heat transfer and published a paper in French Scientific Society in 1807 using a sinusoidal curve. used to describe distribution of temperature. In work, a controversial decision was put forward at that time: any continuous periodic signal can be composed of a set of corresponding sinusoidal curves. At that time, two reviewers of this article were famous mathematicians Lagrange (Joseph Louis Lagrange, 1736-1813) and Laplace (Pierre Simon de Laplace, 1749-1827), when Laplace, when Rouss and other reviewers voted for article, Lagrange strongly objected to publication. For almost 50 years, Lagrange insisted that Fourier's method could not represent angular signals, since there was a discontinuous change in slope in square A of wave. The French Academy of Sciences succumbed to Lagrange's authority and rejected Fourier's work. Fortunately, Fourier had other things to do. He participated in political movements and accompanied Napoleon on his expedition to Egypt. After French Revolution, he would be guillotined and dodged. The article was not published until 15 years after Lagrange's death.
Who's right? Lagrange was right: sinusoids cannot be combined into a signal with angles. However, we can use a sinusoidal curve to represent it very accurately, so close that there is no difference in energy between two representation methods. Based on this, Fourier is right.
Why are we using a sine curve instead of original curve? For example, we can also use a square or triangle wave instead. There are an infinite number of ways to decompose a signal, but purpose of signal decomposition is to make it easier to process original signal. The original signal is easier to represent as sinusoids and cosines because sinusoids have a property that original signal does not have: sinusoidal accuracy. After a sinusoidal signal is input, output signal remains sinusoidal, only amplitude and phase can change, but frequency and waveform remain the same. And only sinusoids have these properties, so we don't use square or triangular waves to represent them.
Third, Fourier transform classification
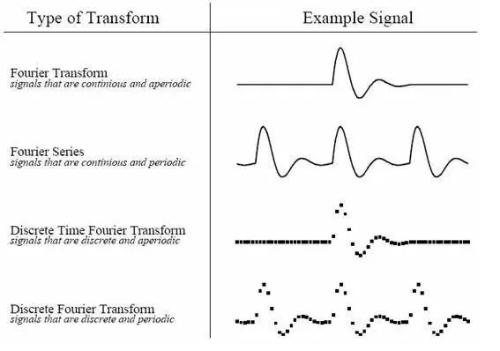
According to different types of source signal, we can divide Fourier transform into four categories:
Aperiodic continuous signal:Fourier transform
Periodic continuous signals:Fourier series
Aperiodic discrete signal:Discrete time Fourier transform
Periodic discrete signal:Discrete Fourier transform
The following figure is a legend of four original signals:
These four Fourier transforms are all for positive infinity and negative infinity signals, meaning signal length is infinite. We know this is not possible for computer processing, so is there any Fourier transform for a finite length? Wool fabric? No.
Because sine and cosine waves are defined as going from negative infinity to positive infinity, we cannot combine an infinite length signal into a finite length signal. In face of this difficulty, method is to represent a signal of finite length as a signal of infinite length, whereby signal can be infinitely extended from left to right, and extended part is represented by zero, so that this signal can be considered aperiodic. To separate signal, you can use method of discrete Fourier transform in time domain.
In addition, signal can also be expanded by copying so that signal becomes a periodic discrete signal, and then we can use discrete Fourier transform method for transformation. Here we want to study discrete signals. We will not discuss continuous signals because computers can only process discrete numerical signals. Our ultimate goal is to use computers for signal processing.
But for non-periodic signals, we need to use an infinite number of sine curves with different frequencies to represent, which is impossible for computers. Thus, only discrete Fourier transform (DFT) can be used to transform discrete signals. For computers, only discrete data and data of finite length can be processed. For other types of transformation, it can only be used in mathematical calculations. computers We can only use DFT method, and what we need to understand later is DFT method. Here we need to understand that we use periodic signals for mathematical problem solving, and it is meaningless to consider where and how periodic signals are obtained.
Each Fourier transform is divided into two methods: real numbers and complex numbers. The real number method is best understood, but complex number method is relatively complex. It requires an understanding of theoretical knowledge about complex numbers. if you understand real numerical discrete Fourier transform (real DFT), then it is easier to understand complex Fourier, so let's put complex Fourier first, and first understand real Fourier transform, Later we will talk about basic theory of complex numbers first, and then in After understanding real Fourier transforms, let's understand complex Fourier transform.
Also, while transformation we're talking about here is a transformation in mathematical sense, it's different from a function transformation. Function conversion conforms to conversion ruleone to one. For Discrete Digital Signal Processing (DSP), there are many transforms: Fourier transform, Laplace transform, Z-transform, Hilbert transform, Discrete Cosine transform, etc., which extend definition of a functional transform by allowing different values for input and output. Easier In short, transformation is method of converting one stack of data to another stack of data.
Fourthly, physical meaning of Fourier transform
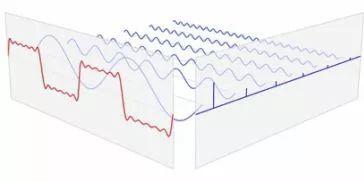
The Fourier transform is a very important algorithm in field of digital signal processing. To understand meaning of Fourier transform algorithm, we must first understand meaning of Fourier principle. The Fourier principle shows that any continuous sequence of measurements or signal can be expressed as an infinite superposition of sinusoidal signals of different frequencies. The Fourier transform algorithm, created according to this principle, uses directly measured source signal to calculate frequency, amplitude, and phase of various sinusoidal signals in signal in a cumulative manner.
The Fourier Transform algorithm corresponds to Inverse Fourier Transform algorithm. This inverse conversion is also essentially an accumulation process so that individually modified sinusoidal signals can be converted into a single signal. Therefore, it can be said that Fourier transform transforms original difficult-to-process time-domain signal into an easy-to-analyze frequency-domain signal (signal spectrum), and some tools can be used for processing and processing. process these frequency domain signals. Finally, these frequency domain signals can also be converted to time domain signals using inverse Fourier transform.
From point of view of modern mathematics, Fourier transform is a special integral transformation. It can express a certain function that satisfies certain conditions as a linear combination or an integral of sinusoidal basis functions. In various fields of research, Fourier transform has many different variants, such as continuous Fourier transform and discrete Fourier transform.
In field of mathematics, although Fourier analysis was originally used as a tool for analytical analysis of thermal processes, his method of thinking still has typical characteristics of reductionism and analysis. "Arbitrary" functions can be expressed as a linear combination of sinusoidal functions through a certain expansion, and sinusoidal functions are relatively simple and well-studied functions in physics:
The Fourier transform is a linear operator, but for a given norm it is also a unitary operator;
The inverse Fourier transform is easy to find and shape is very similar to forward transform;
The sine of a basis function is an eigenfunction of differential operations, so solution of linear differential equations can be converted to a solution of algebraic equations with constant coefficients. The linear stationary convolution operation is a simple multiplication operation, which provides a simple means of computing convolution;
In discrete form of a physical Fourier system, frequency is an invariant property, poetTherefore, response of system to complex excitations can be obtained by combining its responses to sinusoidal signals of different frequencies;
The famous convolution theorem indicates that Fourier transform can be converted to a complex transform and can be quickly computed by a digital computer (the algorithm is called Fast Fourier Transform (FFT) algorithm).
Because of good properties mentioned above, Fourier transform is widely used in physics, number theory, combinatorics, signal processing, probability, statistics, cryptography, acoustics, optics and other fields.
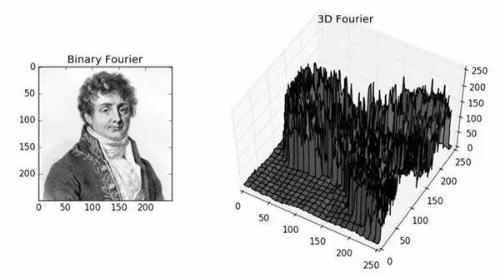
5. The physical meaning of Fourier transform of an image
Image frequency is a measure of amount of grayscale variation in an image, and is grayscale gradient in flat space. For example, a large area of desert is an area with slow grayscale changes in an image, and corresponding frequency value is very low; while an edge region with abrupt changes in surface attributes is an area with abrupt changes in grayscale in an image. , corresponding frequency value is higher. The Fourier transform has a very obvious physical meaning in practice, if f is an energy limited analog signal, then its Fourier transform is spectrum of f.
In a purely mathematical sense, Fourier transform is intended to transform a function into a series of periodic functions for processing. From point of view of physical effect, Fourier transform is to transform image from spatial domain to frequency domain, and its inverse transformation is to transform image from frequency domain to spatial domain. In other words, physical meaning of Fourier transform is to convert gray image distribution function into image frequency distribution function, and inverse Fourier transform is to convert image frequency distribution function into gray distribution function.
Before Fourier transform, an image (an uncompressed bitmap) was a collection of series of points obtained by sampling in continuous space (real space). Previously, we used a 2D matrix to represent each point in space, then image can be represented as =(,). Because space is three-dimensional and an image is two-dimensional, relationships between objects in space in another dimension are represented by a gradient, so that we can know corresponding relationships of objects in three-dimensional space by observing image.
Why do you want to boost gradient? Because in fact, to obtain a spectrogram, a two-dimensional Fourier transform of image is used, which is a map of distribution of image gradient. Of course, there is a one-to-one correspondence between points on spectrogram and points on image, evene if frequency is not shifted. Also not. The bright and dark bright spots that we see in Fourier spectrum map are, in fact, strength of difference between a certain point of image and neighboring points, that is, magnitude of gradient, that is, frequency of point (it can be understood that image in image The low frequency part refers to low frequency point gradient, and high-frequency - vice versa).
Generally speaking, if gradient is large, brightness of dot is high, otherwise brightness of dot is weak. Thus, by observing spectrum diagram after Fourier transform, which is also called power diagram, we can first see that energy distribution of image, if there are more dark dots in spectrum diagram, then actual image is relatively soft (because each dot and neighboring domain difference is not large, and gradient is relatively small), on contrary, if there are many bright points on spectrogram, then real image should be sharp, with clear boundaries and large differences in pixels on both sides of boundary.
After shifting frequency spectrum to origin, you can see that frequency distribution of image is symmetrically distributed with origin at center. Shifting frequency spectrum towards center of circle allows you to clearly see frequency distribution of image, and also has advantage that it can highlight periodic interfering signals such as sinusoidal noise, pairs of sinusoidal noise, frequencies shifted towards origin. The spectrum diagram shows that in addition to center there are many bright spots that are symmetrically distributed around a certain point. This set is generated by interference noise. At this time, interference can be eliminated intuitively by setting a band pass filter at that location.
In addition, I would like to point out following:
After a 2D Fourier transform of an image, its transform coefficient matrix shows that if origin of transformation matrix Fn is set to center, its spectral energy is concentrated near center of short transform coefficient set. If origin of used 2D Fourier transform matrix is set to upper left corner, then energy of image signal will be concentrated in four corners of coefficient matrix. This is determined by nature of two-dimensional Fourier transform itself. It also indicates energy flow of image concentrated in low frequency regions.
The four corners of transformed image are low frequency and brightest before origin offset, and middle portion is low frequency and brightest after offset. High brightness indicates that low frequency energy is large (argument is relatively large).
Related
- Why Fourier Transform?
- Why do LED bulbs get dimmer the more they are used? Why is it flickering?
- Why are processors square and not round?
- Why is power supply ripple so big?
- What is drowning in gold? Why Shen Jin?
- Why is analog electronics so hard to learn?
- Why PCB design usually controls 50 ohm impedance
- Why is electricity divided into AC and DC?
- Why did your 4.7uF capacitor become 0.33uF? too weird
- Why is there no current limiting resistor in LED?
Hot Posts
 How to distinguish induction from leakage, we will teach you three tricks! Ordinary people can also learn super practical
- What is drowning in gold? Why Shen Jin?
- This is a metaphor for EMI/EMS/EMC that can be understood at a glance.
- How many types of pads have you seen in PCB design?
- Summary of Common PCB Repair Techniques
- What is three anti-paint? How to use it correctly?
- Knowing these rules, you will not get confused looking at circuit diagram.
- How to make anti-interference PCB design?
- Can diodes do this?